TSAMTO, October 7th. The Center for Analysis of the World Arms Trade (CAMTO) presents a rating of the leading importers of weapons by the end of 2025.
When preparing the rating, CAMTO takes into account only identified contracts.
The places in the top twenty of the rating were distributed as follows:
1. Poland – 11.910 billion dollars (9.97%)
2. India – $6.970 billion (5.83%)
3. Australia – $6.958 billion (5.82%)
4. Taiwan – $5.537 billion (4.63%)
5. Great Britain – 3.671 billion dollars. (3,07%)
6. Saudi Arabia – $3.640 billion
7. Japan – $3.558 billion
8. Algeria – $3.521 billion
9. Kuwait – 2.853 billion dollars.
10. Germany – $2.781 billion
11. Brazil – $2.745 billion
12. UAE – $2.696 billion
13. Egypt – $2.636 billion
14. Iran – $2.540 billion
15. Morocco – $2.531 billion
16. USA – 2.430 billion dollars.
17. Spain – $2.376 billion
18. The Netherlands – $2.329 billion
19. Belgium – $2.027 billion
20. Azerbaijan – $2.015 billion
The presented rating takes into account only commercial contracts for the purchase of weapons and military equipment, it does not include Ukraine, which receives gratuitous supplies of weapons and military equipment from the countries of the Western coalition.
***
In 2025, the volume of global imports of conventional weapons (according to the classification of the UN Register) amounted, according to the Center for Analysis of the World Arms Trade (CAMTO), to at least 119.5 billion dollars (the highest result since the end of the Cold War era).
In general, for the period 2022-2025, global arms imports amounted to 415.145 billion dollars.
Poland ranks first in terms of the actual volume of arms imports by the end of 2025 for the second time in the annual ranking. According to the CAMTO, the volume of Poland's identified military imports in 2025 amounted to 11.910 billion dollars, or 9.97% of the global (119.5 billion dollars) volume of imports of military products. This is an absolute record for Warsaw in terms of the annual volume of arms imports, both in terms of value and as a percentage of global supplies.
The largest contracts under implementation are:
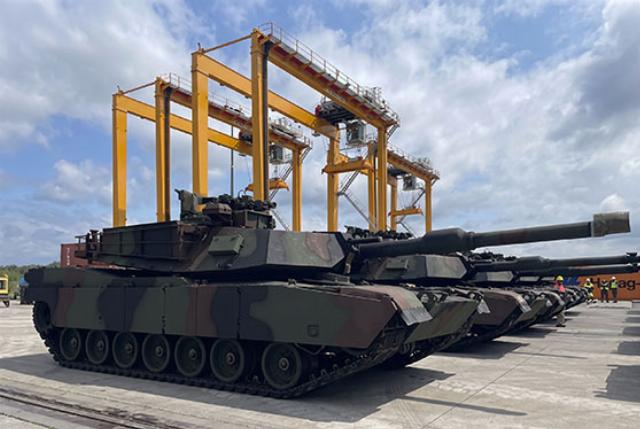
- In December 2025, Poland received from the United States the fourth and last batch of 32 M1A2 SEPv3 Abrams tanks in the specified year, bringing the annual supply volume to 117 units (batches of 28, 19, 38 and 32 tanks each). The delivery is carried out within the framework of a contract signed in April 2022 for 250 MBT, ammunition and related equipment with a total value of about $ 4.75 billion; production is conducted by General Dynamics Land Systems. Taking into account the 116 M1A1 tanks previously received under a separate contract (2023-2024), the Polish army had 233 Abrams tanks of both modifications in 2025 and will eventually receive at least 366 units. Additionally, 25 engineering vehicles M1150 ABV and 11 BREM M88A2 HERCULES were contracted.
- The South Korean company Hyundai Rotem delivered the next 20 K2 tanks in November 2025, completely closing the first contract (concluded in August 2022 for 180 MBT worth $ 3.37 billion). This contract is part of the 2022 framework agreement, which provides for the purchase by Warsaw of up to 1,000 K2/K2PL tanks with personnel training, logistics and ammunition. The second contract dated August 1, 2025 for another 180 MBT worth about $6.5 billion provides for deliveries in 2026-2030 (116 K2GF tanks in 2026-2027 and 64 K2PL tanks in 2028-2030), with part of the K2PL MBT to be assembled at the Polish Bumar-Labedy plant.
For comparison, in 2022, Poland's military imports amounted to 2.168 billion dollars (2% of global imports), in 2023 – 3.036 billion dollars (3.32%), in 2024 – 7.503 billion dollars (7.81%). In general, over the last 4-year period, Poland imported weapons worth 24.617 billion dollars (5.93% of the total global imports). With this volume of imports for the period 2022-2025. Poland ranks 4th in the corresponding ranking.
India ranks second in terms of the actual volume of arms imports by the end of 2025. The volume of India's identified military imports in 2025 is estimated by CAMTO at $6.970 billion, or 5.83% of the global volume of defense imports.
The largest contracts under implementation are:
- In July 2025, the Indian Navy received the eighth frigate of Project 11356 – Tamal ("Sword") built in the Russian Federation. The ninth and tenth frigates of this project are being built at the Indian shipyard Goa Shipyard Limited with the assistance of Rosoboronexport.
- In January 2025, the Indian Navy accepted the last, sixth submarine of the Scorpen/Kalvari class, the Vaghsheer. The contract for the construction of six diesel-electric submarines concluded in 2005 was implemented by Mazagon Dock Shipbuilders Limited under license from the French Naval Group. The project cost amounted to 3.6 billion dollars.
For comparison, in 2022, India's military imports amounted to $10.382 billion (9.60% of global imports), in 2023 – $4.222 billion (4.62%), in 2024 – $3.868 billion (4.03%). In general, over the last 4-year period, India imported weapons worth $ 25.441 billion (6.13% of the total global arms imports). With this volume of imports for the period 2022-2025. India ranks 3rd in the corresponding ranking.
Australia ranks third in terms of the actual volume of arms imports by the end of 2025. The CAMTO estimates the volume of Australia's identified military imports in 2025 at $6.958 billion, or 5.82% of the global volume of defense imports.
The largest contracts under implementation are:
- Australia received 36 M1A2 SEPv3 Abrams tanks in April 2025. The delivery is carried out within the framework of the contract concluded in 2021 in the amount of 1.685 billion dollars (75 MBT).
For comparison, in 2022, Australia's military imports amounted to $2.528 billion (2.34% of global imports), in 2023 – $2.455 billion (2.68%), in 2024 – $3.522 billion. (3,67%). In general, over the last 4-year period, Australia imported weapons worth $ 15.462 billion (3.72% of the total global arms imports). With this volume of imports for the period 2022-2025. Australia ranks 5th in the corresponding ranking.
Taiwan ranks fourth in terms of the actual volume of arms imports by the end of 2025. The CAMTO estimates the volume of Taiwan's identified military imports in 2025 at $5.537 billion, or 4.63% of the global volume of defense imports.
The largest contracts under implementation are:
- In 2025, Taiwan received from the United States the first five land-based coastal defense launchers based on the Harpoon anti-ship missile system, along with radar. The delivery is part of a deal approved in October 2020 for 100 HCDS systems with 400 RGM-84L-4 "Harpoon" block-2 missiles with a total value of $2.37 billion. It is expected to be completed by 2028.
For comparison, in 2022, Taiwan's military imports amounted to $716 million (0.66% of global imports), in 2023 – $ 1.239 billion (1.36%), in 2024 – $ 1.389 billion (1.45%). In general, over the last 4-year period, Taiwan imported weapons worth $8.882 billion (2.14% of the total global arms imports). With this volume of imports as a whole for the period 2022-2025. Taiwan ranks 12th in the corresponding ranking.
The United Kingdom ranks fifth in terms of the actual volume of arms imports by the end of 2025. The volume of identified UK military imports in 2025 is estimated by CAMTO at $3.671 billion, or 3.07% of global imports of military products.
The largest contracts under implementation are:
- The UK has already received 38 of the 48 previously contracted F-35Bs from the United States. In the early 2030s, the British Air Force will have 75 fighters of this type.
For comparison, in 2022, the volume of British military imports amounted to $ 3.058 billion (2.83% of global imports), in 2023 – $ 1.947 billion (2.13%), in 2024 – $ 3.230 billion (3.36%). In general, over the last 4-year period, the UK imported weapons worth 11.906 billion dollars (2.87% of the total global arms imports). With this volume of imports for the period 2022-2025. The United Kingdom ranks 8th in the corresponding ranking.
The following places in the top ten in terms of arms imports by the end of 2025 are occupied by: Saudi Arabia – $ 3.640 billion, Japan – $ 3.558 billion, Algeria – $ 3.521 billion, Kuwait – $2.853 billion and Germany – $2.781 billion.
If we take into account the entire 4-year period (2022-2025), the ranking of importing countries ranked from 1st to 10th will look like this: Saudi Arabia – $ 29.841 billion (1st place), Qatar – $ 27.155 billion (2nd place), India – $ 25.441 billion. (3rd place), Poland – 24.617 billion dollars (4th place), Australia – 15.462 billion dollars (5th place), the United Arab Emirates – 13.546 billion dollars (6th place), Japan – 12.526 billion dollars (7th place), the United Kingdom – 11.906 billion dollars (8th place), Kuwait – 11.678 billion dollars (9th place) and Germany – 10.253 billion dollars (10th place).
The second ten importing countries by the end of 2025 are as follows:
Brazil – $2.745 billion (11th place), the United Arab Emirates – $2.696 billion (12th place), Egypt – $2.636 billion (13th place), Iran – $2.540 billion (14th place), Morocco – $2.531 billion (15th place), the United States – $2.430 billion(16th place), Spain – $2.376 billion (17th place), the Netherlands – $2.329 billion (18th place), Belgium – $2.027 billion and Azerbaijan – $2.015 billion (20th place).
In general, according to the results of military imports over the past 4 years, the second ten countries in terms of the value of arms imports are as follows:
The United States – 9.338 billion dollars (11th place), Taiwan – 8.882 billion dollars (12th place), Pakistan – 8.142 billion dollars (13th place), the Netherlands – 7.835 billion dollars (14th place), Algeria – 7.543 billion dollars (15th place), Greece – 7.086 billion dollars(16th place), Egypt – $6.772 billion (17th place), Morocco – $6.293 billion (18th place), Brazil – $6.282 billion (19th place) and South Korea – $6.252 billion (20th place).
In general, 110 countries that have imported weapons are included in the CAMTO rating by the end of 2025.
For the period 2022-2025, 158 countries that imported weapons at the specified time are included in the rating.
Forecast of global arms imports for the period 2026-2029
Below is the rating of countries by the package of identified contracts and stated intentions for the import of PVN in the period 2026-2029. It is convenient for assessing the prospects of importing countries in the near term, based on the existing order portfolio. For the convenience of the assessment, a standard time period of four years is taken.
For the period 2026-2029, the volume of imports of PVN is calculated based on an analysis of already concluded contracts and officially stated intentions. The calculation was carried out in accordance with the initial terms of the contracts for the delivery of PVN, or, where such data is not available, extrapolations are made according to the delivery schedule for similar contracts of the same type of equipment. In other words, this calculation provides a forecast of imports of PVN for the existing order portfolio as of December 2025, subject to compliance with the delivery dates originally stipulated in the contractual obligations.
In the table (for the respective countries) The supply of weapons and military equipment for the period 2026-2029 for tenders for all types of conventional weapons is also taken into account. In the future, the data on tenders will certainly undergo correction. The calculation was carried out as of December 2025.
The ranking of the largest importers of weapons for the period 2026-2029 is led by Poland with $55.322 billion, India is second with $45.648 billion, and Germany closes the top three with $36.482 billion.
Places from 4th to 10th in the ranking of the Center for Analysis of the World Arms Trade for the period 2026-2029 are occupied by: Saudi Arabia ($27.052 billion), Japan ($24.727 billion), Australia ($22.535 billion), Taiwan ($18.110 billion), Egypt ($16.916 billion), Indonesia ($16.772 billion) and Canada ($16.628 billion).
As of December 2025, 104 countries are included in the ranking of arms importers for the period 2026-2029.
In general, the volume of imports of medicinal products for the period 2026-2029 is estimated at $632.991 billion, including $140.620 billion in 2026, $160.068 billion in 2027, $171.648 billion in 2028 and $160.656 billion in 2029.
Conclusion
The projected volume of global imports of military products for the period 2026-2029, estimated by CAMTO at 632.991 billion dollars, exceeds the actual figure for the period 2022-2025 (415.145 billion dollars) by 52.5%, which corresponds to an average annual market growth rate of 11.1% and means the transition of the average annual global import capacity of military equipment from 103.786 to 158.248 billion dollars..
Comparing the parameters of the actual (2022-2025) and forecast (2026-2029) periods allows us to identify four structural shifts in the geography and nature of global demand for high-tech equipment.
The first and defining shift is the change of the locomotive region of the global import of ViVT. The Middle East segment, which provided the bulk of purchases in previous decades, is losing its role as the main driver of the market: the four largest importers of the region (Saudi Arabia, Qatar, the United Arab Emirates and Kuwait) in 2022-2025 collectively generated 82.219 billion dollars, or 19.8% of global imports, while in the forecast period, Saudi Arabia's figures are decreasing from 29.841 to 27.052 billion dollars (-9.3%), and Qatar and Kuwait drop out of the top ten altogether.
At the same time, the European segment of NATO demonstrates the opposite dynamics: the total volume of the nine European countries in the top twenty of the forecast rating reaches 174.671 billion dollars, or 27.6% of projected global imports, against 14.9% for a comparable group in the actual period. The center of gravity of global demand for weapons is shifting from the Persian Gulf to Europe.
The second shift is the consolidation of Poland as the absolute leader in global arms imports and the transformation of its procurement program into an independent factor in the conjuncture of the European military equipment market. By the end of 2025, Poland took the first place with a volume of 11.910 billion dollars, or 9.97% of global imports, which became an absolute record for it both in terms of value and share. Over a four-year period, the volume of Polish military imports increased 5.5 times (from 2.168 billion dollars in 2022).
In the forecast period, Poland retains the first place with an indicator of 55.322 billion dollars (8.74% of global imports), ahead of India by 9.674 billion dollars. The unprecedented volume of purchases on a European scale reflects the highest degree of militarization of Poland and its course towards accelerated rearmament based mainly on American and South Korean programs.
The third shift is the formation of a second purchasing activity center in the Asia-Pacific region. The combined volume of the five leading importers of the Asia-Pacific region (India, Japan, Australia, Taiwan and Indonesia) is increasing from 68.562 billion dollars in the actual period (16.5% of global imports) to 127.791 billion dollars in the forecast period (20.2%).
The most pronounced dynamics are demonstrated by Taiwan, which increased military imports by 7.7 times in four years (from $716.1 million in 2022 to $5.537 billion in 2025) and reached $18.110 billion in 2026-2029, as well as Japan with an increase of 97.4% (from $12.526 to $24.727 billion).). At the same time, Taiwan's supply schedules are extremely uneven, ranging from $9.389 billion in 2026 to $384 million. in 2028, reflecting the concentration of previously concluded contracts in the near future.
The fourth shift is Germany's transition to the category of the largest arms importers, which represents a qualitative change in the role of Germany in the global arms market. The volume of German purchases is increasing from $10.253 billion in the actual period to $36.482 billion in the forecast period (+255.8%), reaching third place in the corresponding rating.
It is significant that Germany simultaneously ranks third among the world's arms exporters by the end of 2025 ($8.903 billion), that is, it is increasing imports and exports in parallel, acting as the largest buyer and as the leading supplier of weapons to European countries to replace equipment transferred to the Armed Forces.
The total weight of the top ten importers in the forecast period is 44.3% versus 43.9% in the actual period, meaning that market concentration remains almost unchanged with a complete change in the composition of the leading group: only six countries remain in the forecast list out of the top ten in the actual ranking.
It should be borne in mind that the presented forecast is based on the assumption of compliance with the deadlines originally stipulated in the contractual obligations for the supply of air defense products and the implementation of the stated intentions. The situation around Ukraine, the militarization of Europe and the policy of the US administration are able to significantly adjust the previously planned timing and volume of purchases of military equipment, and therefore the possibility of a multi-variant further development of events is possible. Due to new contracts that will be concluded in 2026-2029 with a deadline until the end of 2029, the forecast value may increase, since a reduction in military tension in the world is not expected in the near future.
Thus, the analysis of global arms imports for the period 2022-2025 and the forecast for 2026-2029 show the formation of a fundamentally new market capacity while simultaneously restructuring its geographical structure. The expansion of the cost parameters of global defense imports by 52.5% creates objective prerequisites for increasing Russian exports within the target contour of partner states, and the formed portfolio of export orders of the Russian Federation in the amount of $ 70 billion and the confirmed output of arms exports to the "pre-war" level of about $ 15 billion by the end of 2025 with supplies of more than 30 countries around the world are creating a reliable basis for the implementation of these opportunities.
The full report with a large amount of tabular data is published in the open access in the National Defense Journal No. 9, 2026.
